Investor Data Room · FY 2026

VS - Data Room - July 2026

Confidential · prepared for due diligence
Memorandum · Versiani Swim · July 2026

A strong brand,
built with AI as leverage.


The idea

There is one way of wearing a bikini that the whole world wants to copy: the Brazilian way. Versiani Swim was built for the women who are the essence of Brazil — self-assured and independent, they claim their moment in the sun and their time for self-care. A native brand of the creator economy — a market expected to triple by 2030 — VS was founded by Gabriela Versiani, whose combined audience tops 10 million. The pieces she designs become objects of desire: they dress the country's biggest influencers and celebrities and define what a Brazilian bikini is — like the Fita, a string-tie model and one of the most viral pieces on the internet, now the brand's signature on the beach.

We own what creates value and desire — brand, product creation and marketing. Production and logistics are outsourced, orchestrated by our own data.

And the leverage is AI: from marketing to finance, proprietary agents and processes make VS the perfect laboratory for the new-economy ecommerce model.

What the business has already proven
Last 12 months
  1. R$ 14.6MLTM revenue, growing 30% a year
  2. +173%in the fitness line — the second growth curve
  3. 7.92×blended MER — every real of media comes back almost eightfold
  4. 73.9%initial contribution margin
  5. 4.3 monthsCAC payback
  6. 97.1%of orders delivered on time — outsourced logistics, in-house management and data
Where we are going
Three moves
Brand
The reference in beachwear & fitness
Monthly drops widen the portfolio with every collection, from beach to fitness. Behind them: an active community of women, a network of more than 2,000 registered influencers and the founder as the face — the combination that cements VS as the category reference.
Production
Direct sourcing in China
Finished product negotiated straight with the factory, no middlemen — more margin and the capacity to scale without weighing down the operation.
Frontier
Brazilian bikinis in the U.S.
Taking the Brazilian Core to the largest consumer market in the world: the beauty, the charm and the sensuality of the Brazilian woman, exported as culture. Miami and Orlando (Florida): the largest concentrations of Brazilians outside the country, and sun all year round — the ideal launch point for a Brazilian bikini.
Why no one replicates it
The layers of the moat
  1. Creator founder, +10M combined audienceThe soul of the brand is the founder herself: an audience built over years of trust.
  2. Celebrities who wear it organicallyThe country's biggest names wear VS spontaneously, without a cent of paid media — just the pieces we send.
  3. Direct relationship with the customer100% D2C sales, which keeps every customer relationship close
  4. AI-native companyAI as leverage from marketing to operations, with a lean team and high execution power

Copying one layer is possible. Copying all four at once is not.

Revenue Breakdown · LTM · R$

Strong core,
Fitness scaling.

Bikinis account for 62% of revenue, while the Fitness line nearly tripled in one year — diversifying the base. R$ 14.6M in LTM revenue, +30% over the prior period.


Revenue · LTM
R$ 14.6M
from R$ 11.2M (+30%)
Bikinis · core
62.5%
R$ 8.5M
Fitness · expansion
+173%
R$ 1.6M → R$ 4.4M
Peak · best month
R$ 3.8M
Jul-26

Mix by product line
Share of LTM revenue · FY-1 → LTM evolution
Bikinis
62.5% · R$ 8.47Mstable
Fitness
32.2% · R$ 4.36M+173%
Apparel
5.3% · R$ 0.72M−38%

The bikini core remains stable and dominant, while Fitness jumped from R$ 1.6M to R$ 4.4M in one year — evidence that the brand extends beyond swimwear.

Brand & Desire · @versianiswim

The brand is the desire created by the women who wear the products.

The owned audience adds up to ~11.2 million followers across founder and brand — and the pieces travel organically on the bodies of the country's biggest celebrities.


Owned audience
Instagram followers · founder + brand
@gabrielaversiani · founder
10.8M
+
@versianiswim · brand
410k
=
Owned audience
~11.2M
Influencers w/ the brand
+3k
active creator network
Posts published
2,442
@versianiswim
Influencer spend
R$ 386k
LTM
Influencer ROAS
3.33×
attributed · LTM

Wall of desire
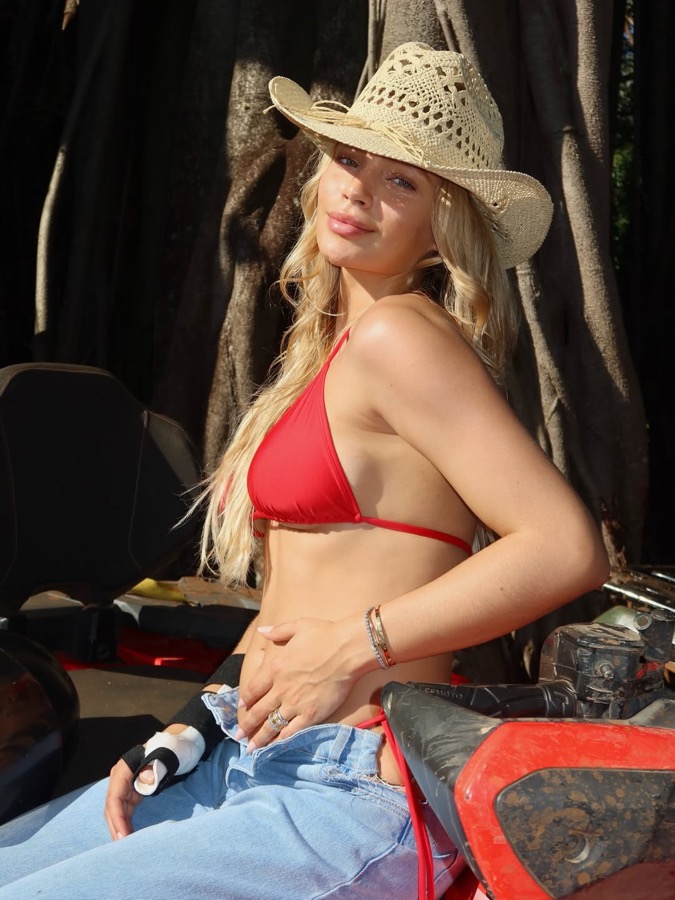
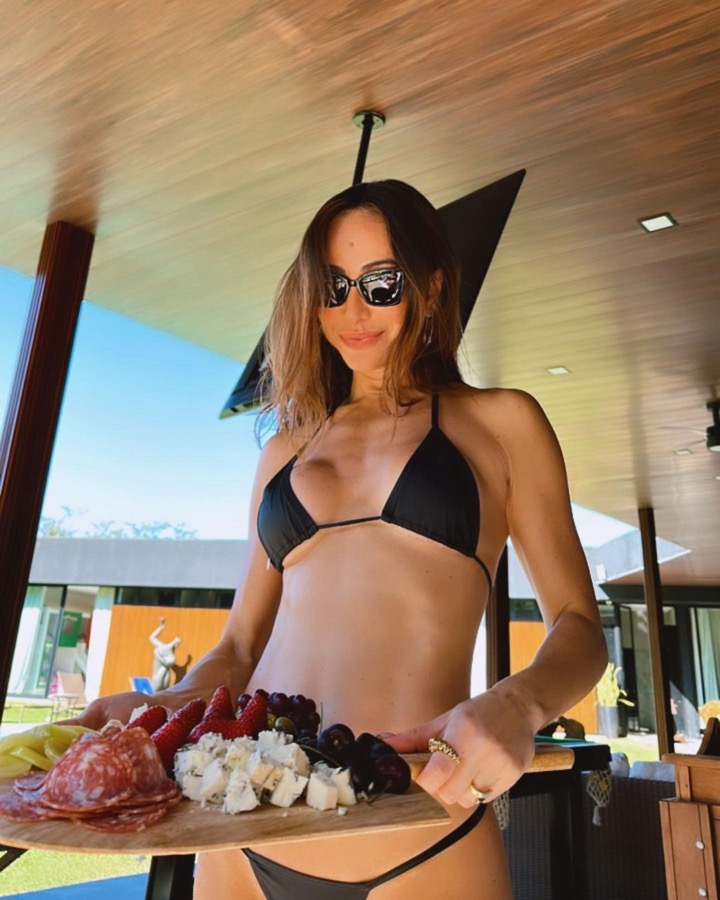
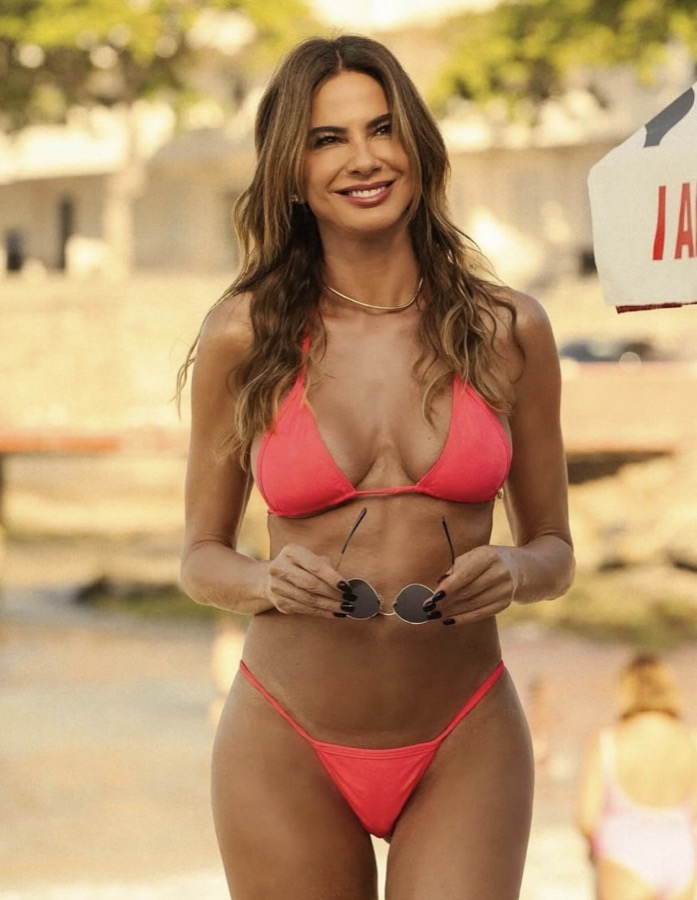
Celebrities publicly documented wearing the brand

Virginia Fonseca
Virginia Fonseca
Influencer
Gabriely
Gabriely
Influencer
Sabrina Sato
Sabrina Sato
TV Host
Juliette
Juliette
Singer
Ana Castela
Ana Castela
Singer
Bruna Biancardi
Bruna Biancardi
Influencer
Luísa Sonza
Luísa Sonza
Singer
Paolla Oliveira
Paolla Oliveira
Actress
Luciana Gimenez
Luciana Gimenez
TV Host
Influence as a channel
Creator network · investment and return
FrontScaleReturn
Influencer channel (paid media)R$ 386k LTM3.33×
Commissioned creator networkdedicated platformcommission per sale
Founder event collection · Bridal EditionSep-26repeat-purchase trigger
Unit Economics · FY 2026 · R$

Margin that sustains,
payback that accelerates.

Every order starts with a 74% gross margin and pays back in just over four months. The value lever is repeat purchase — still being built.


AOV
R$ 349
AOV
Gross margin
73.9%
product
LTV / CAC
2.66×
target >3×
CAC payback
4.3
months · target <6
MER
7.9×
bench 2–4×

LTV build-up
Contribution per order × lifetime orders per customer
Contribution / order
R$ 108
×
Orders / customer
1.64
=
LTV (contribution)
R$ 178
vs
Blended CAC
R$ 67
Blended metrics
Value vs. DTC / swimwear benchmark
MetricValueBenchmarkStatus
Average order value (AOV)R$ 349R$ 80–140 typicalAbove
Gross margin (product)73.9%65–75%Top of range
Contribution margin30.6%30–45%In range
MER (marketing efficiency)7.8×2–4×Above
Blended CACR$ 67Low
LTV / CAC2.66×> 3×On track
12m repeat purchase21.8%25–40%On track
Return rate18.8%20–35% (swim)Below

Returns below benchmark are a positive — swimwear is a highly size-sensitive category. LTV/CAC and repeat purchase are the expansion levers, underpinned by strong margin and MER.

CAC by channel · 2026
Acquisition efficiency · ROAS by paid channel
ChannelSpendNew customersCACROAS
Meta (FB/IG)R$ 636,5753,946R$ 161
2.27×
GoogleR$ 132,5982,347R$ 57
6.43×
TikTokR$ 148,5784,228R$ 35
5.63×
InfluencerR$ 176,7591,699R$ 104
6.27×
Organic / Direct7,059 · 29.3%R$ 0
pull
Blended totalR$ 1,094,51024,084R$ 45
8.43×
Marketing · FY 2026 · R$

Efficient scale,
a brand that pulls.

Media spend grew 16× in two years — and efficiency held. Blended MER of 7.9×, nearly double the top of the benchmark range. The brand remains the single largest acquisition engine.


Blended MER
7.92×
bench 2–4×
New-customer MER
4.87×
bench 1.2–2×
LTM spend
R$ 1.84M
from R$ 116k in FY-2
Attributed revenue
R$ 5.46M
LTM

Spend by channel
Spend evolution · FY-2 → FY-1 → LTM · attributed ROAS
ChannelFY-2FY-1LTMROAS LTM
Meta (FB/IG)R$ 91kR$ 671kR$ 888k2.08×
Google SearchR$ 10kR$ 34kR$ 59k18.03×
Google Perf MaxR$ 14kR$ 79kR$ 147k2.82×
TikTokR$ 149k5.63×
InfluencerR$ 110kR$ 386k3.33×
EventsR$ 68k
OtherR$ 24kR$ 143k
TotalR$ 116kR$ 918kR$ 1.84M

Google Search delivers 18× ROAS on just 3% of total spend — an underused channel with clear headroom to scale. TikTok went from zero to 5.6× in a single year.

Blended MER
Total net revenue over total marketing spend
Net revenue
R$ 14.6M
÷
Marketing spend
R$ 1.84M
=
Blended MER
7.92×

MER (7.9×) runs ahead of attributed ROAS (3.0×) because it captures all revenue — including organic, which media attribution does not pick up. DTC swim benchmark: 2–4×.

Retention & base health
List, engagement and repeat purchase
Email list
62,467
subscribers
Open rate
45.5%
Klaviyo · 30d
Active flows
11
Klaviyo
12-month repeat rate
19.2%
2+ paid orders
MetricValueRead
% of revenue via email/SMS2.1%upside — underused channel
Click rate (email)0.5%engagement to unlock
SMS list0channel fully inactive
Cohort Analysis · Aug-2025 – Jul-2026 · R$

Strong acquisition,
retention still building.


New customers
29,919
12 cohorts
Largest cohort
7,957
Nov-25 · Black Friday
Acquisition revenue (M0)
R$ 10.2M
sum of M0
12-month repeat rate
19.2%
2+ paid orders

Revenue retention by cohort
% of acquisition-month (M0) revenue retained in each subsequent month · the greener the cell, the higher the retention
CohortNewM0M1M2M3M4M5M6M7M8M9M10M11
Aug-251,34110010.212.525.68.43.59.16.87.88.22.813.9
Sep-251,3431008.216.76.62.54.44.74.73.92.36.0
Oct-251,57510017.44.73.63.84.35.34.82.66.3
Nov-257,9571004.32.53.63.14.53.21.46.9
Dec-253,3021004.94.32.94.23.71.14.5
Jan-262,14010010.45.55.04.51.55.7
Feb-261,3131008.39.17.02.67.9
Mar-261,1451009.810.13.78.9
Apr-262,09610010.32.79.3
May-261,2341005.911.5
Jun-2668310018.8
Jul-265,790100
Inventory & COGS · FY 2026 · R$

High margin,
lean domestic sourcing.

Every unit is marked up 74% over cost and sustains a 69% gross margin, with very little discounting. Domestic production — no international freight, FX or tariff exposure.


IMU (initial markup)
74%
initial markup
Gross margin
69.3%
on net revenue
Landed cost
R$ 59
per unit
Markdown
27.7%
vs. base price
Hero SKU
70.2%
top 10 · revenue

Gross Margin Walk · LTM
From base price (average compare-at) to gross margin, per unit
Base price (compare-at)
R$ 241.67
− Markdown
− 66.94
= List price
R$ 174.73
− Order discounts
− 16.52
− Cost of returns
− 8.80
= Net revenue / unit
R$ 149.41
− Product cost
− 40.43
− Freight in
− 0.52
− Taxes
− 4.85
= Gross margin / unit
R$ 103.61
Unit cost structure
From factory cost to price · IMU (initial markup) 74%
Wholesale (factory)
R$ 52.80
+
Taxes ~12%
R$ 6.34
=
Landed cost
R$ 59.14
Selling price
R$ 174.73

Domestic inbound freight is immaterial (<1% of COGS) and import duty is zero — domestic production, with no FX or tariff exposure. Already embedded in the landed cost.

Catalog & sourcing
Assortment, concentration and supply chain
Active SKUs49 · 3,412 variants
Hero SKUs (top 10)70.2%
Lead time — PO → receipt6 weeks
MOQ per SKU100 units
Markdown rate27.7%
Freight In (% of COGS)<1%
Import duty & tariffs0%
Average selling priceR$ 174.73

Short lead time (6 weeks) and low MOQ (100 units) — the domestic supply chain delivers replenishment agility that importers do not have. Concentration in validated hero products: 70% of revenue in the top 10.

Being finalized
Metrics dependent on the 2025 financial statements
2025 financial statements · expected first week of August
Ending inventory (R$)being finalized
COGS (P&L)being finalized
Average inventory (R$)being finalized
Inventory turnoverbeing finalized
DSI (days sales of inventory)being finalized
Provisions / write-downsbeing finalized

The accounting firm was replaced and the previous one did not deliver the 2025 close. Tax documents are being consolidated with the new team; COGS, ending inventory and provisions will be released with the closed financial statements — expected by the first week of August.

Operations · LTM · R$

Fast delivery,
risk under control.

Lean outsourced fulfillment, 97% of orders shipped on time and chargebacks at 0.44% — half the card network ceiling. The operation scales without losing control.


On-time delivery
97.1%
on time
Chargeback
0.44%
network ceiling 1%
Fulfillment
R$ 5.25
per order
Net returns
3.5%
net of exchanges
Shipping / order
R$ 13.57
customer covers 13.11

Fulfillment & logistics
Operating cost and delivery network
Fulfillment cost / orderR$ 5.25
Logistics operator (3PL)CrossDo
Fulfillment as % of revenue2.2%
Distribution centerNova Lima · MG
Outbound shipping / orderR$ 13.57
% orders with free shipping3.4%
Shipping recovery (customer)R$ 13.11
Free shipping thresholdR$ 449

Customers cover 97% of shipping — the subsidy (R$ 0.45/order) comes only from occasional free shipping promotions. Fulfillment at 2.2% of revenue, with an outsourced domestic operator (CrossDo).

Returns & quality
Reverse logistics and defects
Return rate — gross9.7%
Return rate — net of exchanges3.5%
Order defect ratebeing instrumented
Restocking (% resellable)being instrumented
Processing cost / returnbeing instrumented

Net returns of only 3.5% — most of it is size exchange, not buyer's remorse. Swimwear is a category naturally sensitive to fit.

Payment risk
Fraud and disputes
Chargeback rate0.44%
Fraud rate1.30%
Chargeback loss (year)R$ 20.4k
Card network ceiling (Visa/MC)0.9% – 1.5%

Anti-fraud contains the loss: even with fraud attempts, chargebacks stay at 0.44% — half the ceiling. Financial risk is small and controlled.

Customer service
Identified bottleneck · AI platform in operation
CS platformVenda.AI
Tickets / 100 orders45
First response (AI)immediate
Wait for human agent~6h
NPSbeing instrumented

Customer service volume is the acknowledged bottleneck of the operation. The response is already underway: rollout of Venda.AI, an AI agent that answers instantly and relieves the human queue — with NPS and response time instrumentation to follow.

Cap Table · FY 2026

A clean ownership structure.

Two shareholders, 60/40, no prior dilution, no option pool and no convertible debt. A simple, transparent base for a new investor to come in.


RNA Group
60%
control
Gabriela Versiani
40%
founder
Total quotas
20
fully diluted
Outside investors
0
clean cap table

Ownership structure
Fully diluted ownership
60%
RNA Group Ltda
40%
Gabriela Versiani
ShareholderSecurityQuotas% FD
RNA Group Ltda
CNPJ 65.513.088/0001-90 · managed by Rafael Assis Carvalho
Quotas1260.00%
Gabriela Versiani Porto Fernandes Ltda
CNPJ 36.996.513/0001-41
Quotas840.00%
Total20100.00%

Cap table with no prior rounds, convertibles or debt — the new investor comes in on a clean base. The exit waterfall will be modeled alongside the round terms.

Team · Versiani Swim

Brand, operations and growth,
in one complementary team.


Team
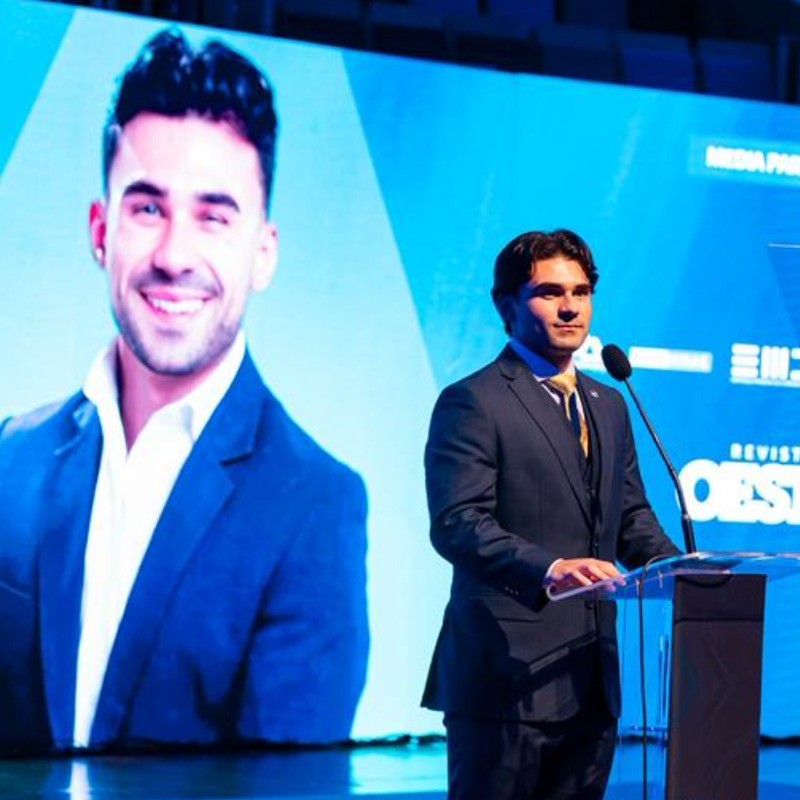
RARafael Assis Carvalho
Rafael Assis
CEO
RNA Group
JPJoão Paulo Mafra
João Paulo Mafra
Supply Chain Manager
RNA Group
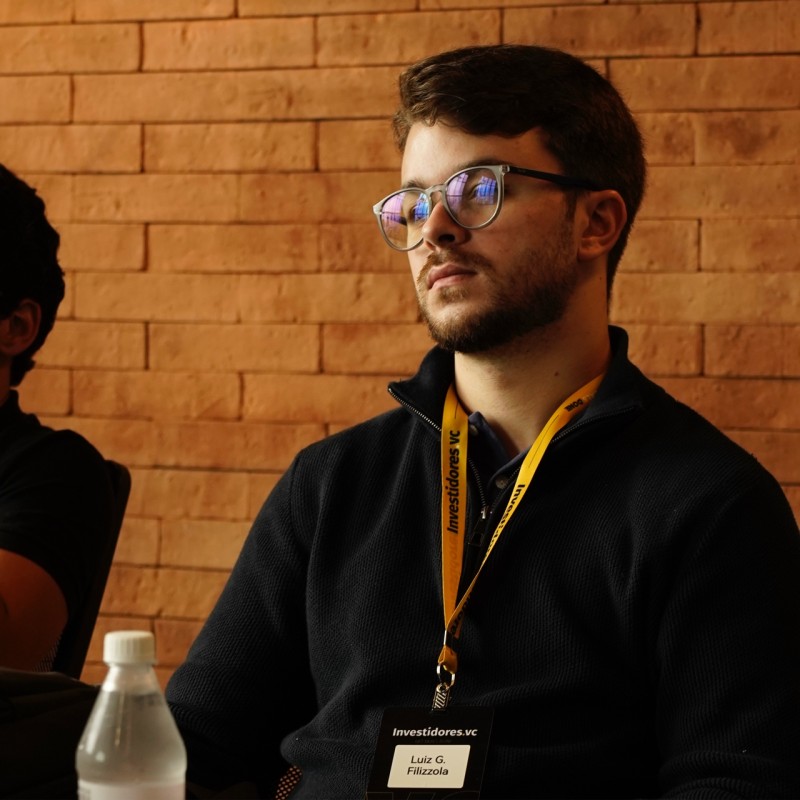
LGLuiz Gustavo Filizola
Luiz Gustavo Filizola
Growth & Marketing Manager
ex-Bagy · RNA Group
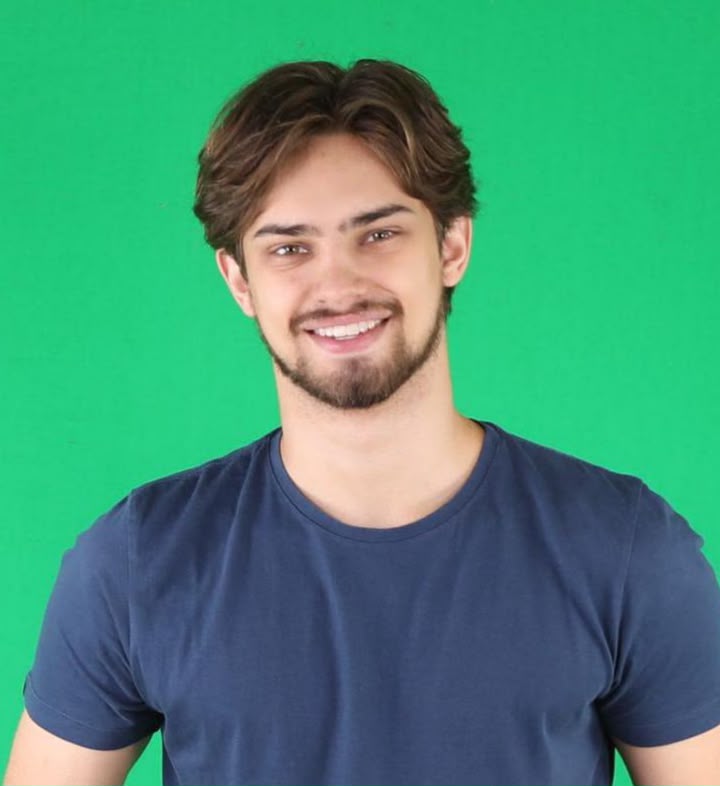
GRGabriel Ramos
Gabriel Ramos
Growth Marketing Specialist
Performance & acquisition
GAGabriel Apgaua Zeh
Gabriel Apgaua
Operations Manager
ex-Milpan
LPLaís Procopio
Laís Procopio
Product Design Manager
ex-Bolovo
LCLisiê Cardoso
Lisiê Cardoso
Social Media Manager
ex-G4 Educação
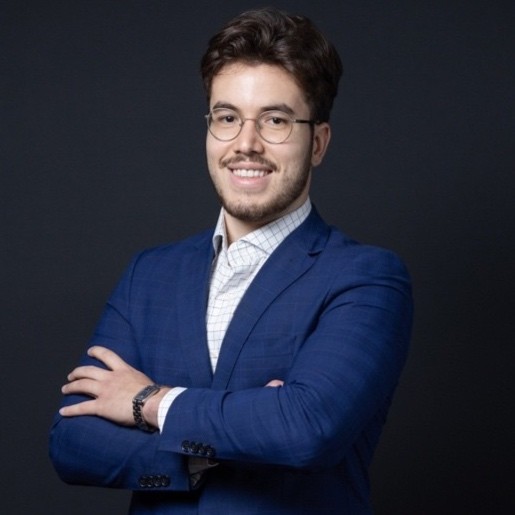
LFLuiz Felipe Machado Dias
Luiz Felipe Dias
Finance & Ops Manager
ex-One Investimentos

Board · Advisors
PRPedro Rabelo
Pedro Rabelo
Advisor
Founder of Bagy
PMPedro Mafra Mendes
Pedro Mafra Mendes
Advisor
ex-COO Moon Ventures